Inside this article, we will see the concept of Laravel 9 How To Integrate Pie Chart Using HighChart. This article will be step by step graph integration tutorial.
Pie chart represents the information in very graphical view which provides the complete idea about data. We will use jQuery Highcharts to add Pie chart into Laravel 9 application.
The Highcharts library comes with all the tools you need to create reliable and secure data visualizations. Built on JavaScript and TypeScript.
If you are wondering to learn to create dynamic pie chart using highchart concept in laravel 9 then this article will help a lot to learn everything.
Learn More –
- Laravel 9 How To Generate PDF Using DomPDF Tutorial
- Laravel 9 How To Integrate Bar Chart Using HighChart Tutorial
- Laravel 9 How To Integrate Line Chart Using HighChart Tutorial
- Laravel 9 How To Send Email To Multiple Users Tutorial
Let’s get started.
Laravel Installation
Open terminal and run this command to create a laravel project.
composer create-project laravel/laravel myblogIt will create a project folder with name myblog inside your local system.
To start the development server of laravel –
php artisan serveURL: http://127.0.0.1:8000
Assuming laravel already installed inside your system.
Create Database & Connect
To create a database, either we can create via Manual tool of PhpMyadmin or by means of a mysql command.
CREATE DATABASE laravel_app;
To connect database with application, Open .env file from application root. Search for DB_ and update your details.
DB_CONNECTION=mysql
DB_HOST=127.0.0.1
DB_PORT=3306
DB_DATABASE=laravel_app
DB_USERNAME=root
DB_PASSWORD=root
Create Model & Migration
Open project into terminal and run this command to create model and migration file.
$ php artisan make:model BrowserStat -mIt will create two files –
- Model – BrowserStat.php at /app/Models folder
- Migration file – 2022_04_04_145928_create_browser_stats_table.php at /database/migrations folder.
Open Migration file and write this complete code into it.
<?php
use Illuminate\Database\Migrations\Migration;
use Illuminate\Database\Schema\Blueprint;
use Illuminate\Support\Facades\Schema;
return new class extends Migration
{
/**
* Run the migrations.
*
* @return void
*/
public function up()
{
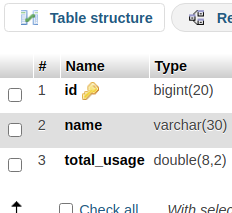
Schema::create('browser_stats', function (Blueprint $table) {
$table->id();
$table->string("name", 30);
$table->float("total_usage");
});
}
/**
* Reverse the migrations.
*
* @return void
*/
public function down()
{
Schema::dropIfExists('browser_stats');
}
};
Open model file BrowserStat.php and write this complete code into it.
<?php

namespace App\Models;

use Illuminate\Database\Eloquent\Factories\HasFactory;
use Illuminate\Database\Eloquent\Model;

class BrowserStat extends Model
{
    use HasFactory;

    public $timestamps = false;
}
Run Migration
Back to terminal and run this command.
$ php artisan migrateIt will create browser_stats table inside database.
Create Data Seeder
Next,
Create a seeder file to seed some dummy data for table.
Run this command to terminal –
$ php artisan make:seeder BrowserStatSeederIt will create a file BrowserStatSeeder.php at /database/seeders folder.
Open BrowserStatSeeder.php and write this complete code into it.
<?php
namespace Database\Seeders;
use Illuminate\Database\Console\Seeds\WithoutModelEvents;
use Illuminate\Database\Seeder;
use App\Models\BrowserStat;
class BrowserStatSeeder extends Seeder
{
/**
* Run the database seeds.
*
* @return void
*/
public function run()
{
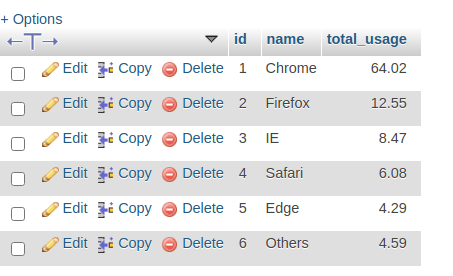
$data = [
array(
"name" => "Chrome",
"total_usage" => 64.02
),
array(
"name" => "Firefox",
"total_usage" => 12.55
),
array(
"name" => "IE",
"total_usage" => 8.47
),
array(
"name" => "Safari",
"total_usage" => 6.08
),
array(
"name" => "Edge",
"total_usage" => 4.29
),
array(
"name" => "Others",
"total_usage" => 4.59
)
];
BrowserStat::insert($data);
}
}
Run Seeder File
Run this command to terminal.
$ php artisan db:seed --class=BrowserStatSeederIt will create test data into database table.
Create Controller
Next, we need to create a controller file.
$ php artisan make:controller BrowserControllerIt will create a file BrowserController.php at /app/Http/Controllers folder.
Open BrowserController.php and write this complete code into it.
<?php

namespace App\Http\Controllers;

use Illuminate\Http\Request;
use App\Models\BrowserStat;

class BrowserController extends Controller
{
    public function index()
    {
        $browsers = BrowserStat::all();

        $dataPoints = [];

        foreach ($browsers as $browser) {

            $dataPoints[] = [
                "name" => $browser['name'],
                "y" => floatval($browser['total_usage'])
            ];
        }

        return view("pie-chart", [
            "data" => json_encode($dataPoints)
        ]);
    }
}
Create Template File
Go to /resources/views folder and create a file with name pie-chart.blade.php
Open pie-chart.blade.php and write this complete code into it.
<!DOCTYPE html>
<html lang="en">

<head>
    <title>Pie Chart Integration in Laravel 9</title>
    <meta charset="utf-8">
    <meta name="viewport" content="width=device-width, initial-scale=1">
    <link rel="stylesheet" href="https://maxcdn.bootstrapcdn.com/bootstrap/3.4.1/css/bootstrap.min.css">
    <script src="https://ajax.googleapis.com/ajax/libs/jquery/3.5.1/jquery.min.js"></script>
    <script src="https://maxcdn.bootstrapcdn.com/bootstrap/3.4.1/js/bootstrap.min.js"></script>
</head>

<body>

    <div class="container">
        <h3 style="text-align: center;">Pie Chart Integration in Laravel 9</h3>
        <div class="panel panel-primary">
            <div class="panel-heading">Pie Chart Integration in Laravel 9</div>
            <div class="panel-body">
                <div id="pie-chart"></div>
            </div>
        </div>
    </div>

    <script src="https://code.highcharts.com/highcharts.js"></script>
    <script src="https://code.highcharts.com/modules/exporting.js"></script>
    <script src="https://code.highcharts.com/modules/export-data.js"></script>
    <script src="https://code.highcharts.com/modules/accessibility.js"></script>
    <script>
        $(function() {
            Highcharts.chart('pie-chart', {
                chart: {
                    plotBackgroundColor: null,
                    plotBorderWidth: null,
                    plotShadow: false,
                    type: 'pie'
                },
                title: {
                    text: 'Browser Usage World wide'
                },
                tooltip: {
                    pointFormat: '{series.name}: <b>{point.percentage:.1f}%</b>'
                },
                accessibility: {
                    point: {
                        valueSuffix: '%'
                    }
                },
                plotOptions: {
                    pie: {
                        allowPointSelect: true,
                        cursor: 'pointer',
                        dataLabels: {
                            enabled: true,
                            format: '<b>{point.name}</b>: {point.percentage:.1f} %'
                        }
                    }
                },
                series: [{
                    name: 'Browsers',
                    colorByPoint: true,
                    data: <?= $data ?>
                }]
            });
        });
    </script>
</body>

</html>
Add Route
Open web.php file from /routes folder. Add this route into it.
//...

use App\Http\Controllers\BrowserController;

//...

Route::get('browser-usage', [BrowserController::class, 'index']);

//...
Application Testing
Run this command into project terminal to start development server,
php artisan serveURL: http://127.0.0.1:8000/browser-usage
Once we open this URL, Pie Chart will be generated using Highchart plugin.
Output
<meta http-equiv="content-type" content="text/html; charset=utf-8">Graph of Browser & about their Usage.
We hope this article helped you to learn about Laravel 9 How To Integrate Pie Chart Using HighChart Tutorial in a very detailed way.
If you liked this article, then please subscribe to our YouTube Channel for PHP & it’s framework, WordPress, Node Js video tutorials. You can also find us on Twitter and Facebook.
Read more