Inside this article, we will see the concept of Google Line Chart Integration in Laravel 9. This article will be step by step graph integration tutorial.
Line chart represents the information in very graphical view which provides the complete idea about data. We will use google library to add Line chart into Laravel 9 application.
The Google library comes with all the tools you need to create reliable and secure data visualizations. Built on JavaScript.
If you are wondering to learn to create dynamic line chart using google library concept in laravel 9 then this article will help a lot to learn everything.
Learn More –
- Laravel 9 Seed Database Using Faker Library Tutorial
- Laravel 9 Send Mail Using Gmail SMTP Server Tutorial
- Google Bar Chart Integration in Laravel 9 Tutorial
- Google Pie Chart Integration in Laravel 9 Tutorial
Let’s get started.
Laravel Installation
Open terminal and run this command to create a laravel project.
composer create-project laravel/laravel myblogIt will create a project folder with name myblog inside your local system.
To start the development server of laravel –
php artisan serveURL: http://127.0.0.1:8000
Assuming laravel already installed inside your system.
Create Database & Connect
To create a database, either we can create via Manual tool of PhpMyadmin or by means of a mysql command.
CREATE DATABASE laravel_app;
To connect database with application, Open .env file from application root. Search for DB_ and update your details.
DB_CONNECTION=mysql
DB_HOST=127.0.0.1
DB_PORT=3306
DB_DATABASE=laravel_app
DB_USERNAME=root
DB_PASSWORD=root
Create Model & Migration
Open project into terminal and run this command to create model & migration file.
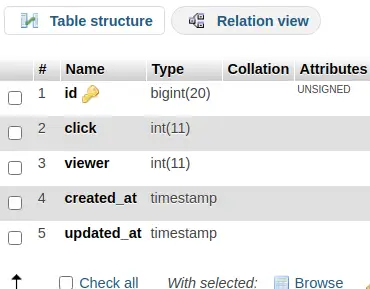
$ php artisan make:model Visitor -mIt will create two files –
- Model – Visitor.php at /app/Models folder
- Migration file – 2022_04_18_123805_create_visitors_table.php at /database/migrations folder.
Open Migration file and write this complete code into it.
<?php

use Illuminate\Database\Migrations\Migration;
use Illuminate\Database\Schema\Blueprint;
use Illuminate\Support\Facades\Schema;

return new class extends Migration
{
    /**
     * Run the migrations.
     *
     * @return void
     */
    public function up()
    {
        Schema::create('visitors', function (Blueprint $table) {
            $table->id();
            $table->integer('click');
            $table->integer('viewer');
            $table->timestamps();
        });
    }

    /**
     * Reverse the migrations.
     *
     * @return void
     */
    public function down()
    {
        Schema::dropIfExists('visitors');
    }
};
Run Migration
Back to terminal and run this command.
$ php artisan migrateIt will create visitors table inside database.
Insert Test Data
Next,
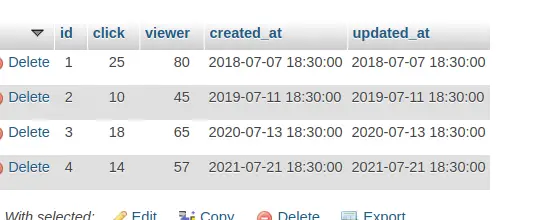
Open application database and run this MySQL query to insert test data into visitors table.
--
-- Dumping data for table `visitors`
--

INSERT INTO `visitors` (`id`, `click`, `viewer`, `created_at`, `updated_at`) VALUES
(1, 25, 80, '2018-07-07 18:30:00', '2018-07-07 18:30:00'),
(2, 10, 45, '2019-07-11 18:30:00', '2019-07-11 18:30:00'),
(3, 18, 65, '2020-07-13 18:30:00', '2020-07-13 18:30:00'),
(4, 14, 57, '2021-07-21 18:30:00', '2021-07-21 18:30:00');
Right now, we have only these few rows of dummy data. You can take more rows in it. These data will help to draw graph between Total Click, Total Viewers according to Year wise.
You will see something like this after this test data insertion.
Create Controller
Next, we need to create a controller file.
$ php artisan make:controller GraphControllerIt will create a file GraphController.php at /app/Http/Controllers folder.
Open GraphController.php and write this complete code into it.
<?php

namespace App\Http\Controllers;

use Illuminate\Http\Request;
use App\Models\Visitor;
use Illuminate\Support\Facades\DB;

class GraphController extends Controller
{
    public function index()
    {
        $visitor = Visitor::select(
            DB::raw("year(created_at) as year"),
            DB::raw("SUM(click) as total_click"),
            DB::raw("SUM(viewer) as total_viewer")
        )
            ->orderBy(DB::raw("YEAR(created_at)"))
            ->groupBy(DB::raw("YEAR(created_at)"))
            ->get();

        $result[] = ['Year', 'Click', 'Viewer'];
        foreach ($visitor as $key => $value) {
            $result[++$key] = ["$value->year", (int)$value->total_click, (int)$value->total_viewer];
        }

        return view('line-chart')
            ->with('visitor', json_encode($result));
    }
}
Create Template File
Go to /resources/views folder and create a file with name line-chart.blade.php
Open line-chart.blade.php and write this complete code into it.
<html>
  <head>

    <title>How To Integrate Google Line Chart in Laravel 9 - Online Web Tutor</title>

    <script type="text/javascript" src="https://www.gstatic.com/charts/loader.js"></script>
    <script type="text/javascript">

      var visitor = <?php echo $visitor; ?>;
      console.log(visitor);
      google.charts.load('current', {'packages':['corechart']});
      google.charts.setOnLoadCallback(drawChart);

      function drawChart() {
        var data = google.visualization.arrayToDataTable(visitor);
        var options = {
          title: 'Site Visitor Line Chart',
          curveType: 'function',
          legend: { position: 'bottom' }
        };
        var chart = new google.visualization.LineChart(document.getElementById('linechart'));
        chart.draw(data, options);
      }

    </script>
  </head>
  <body>
    <h3 style="text-align: center;">How To Integrate Google Line Chart in Laravel 9</h3>
    <div id="linechart" style="width: 900px; height: 500px"></div>
  </body>
</html>
Add Route
Open web.php file from /routes folder. Add this route into it.
//...

use App\Http\Controllers\GraphController;

//...

Route::get('line-chart', [GraphController::class, 'index']);

//...
Application Testing
Run this command into project terminal to start development server,
php artisan serveURL: http://127.0.0.1:8000/line-chart
Output
Graph of Total Clicks, Total Visitors according to Year wise.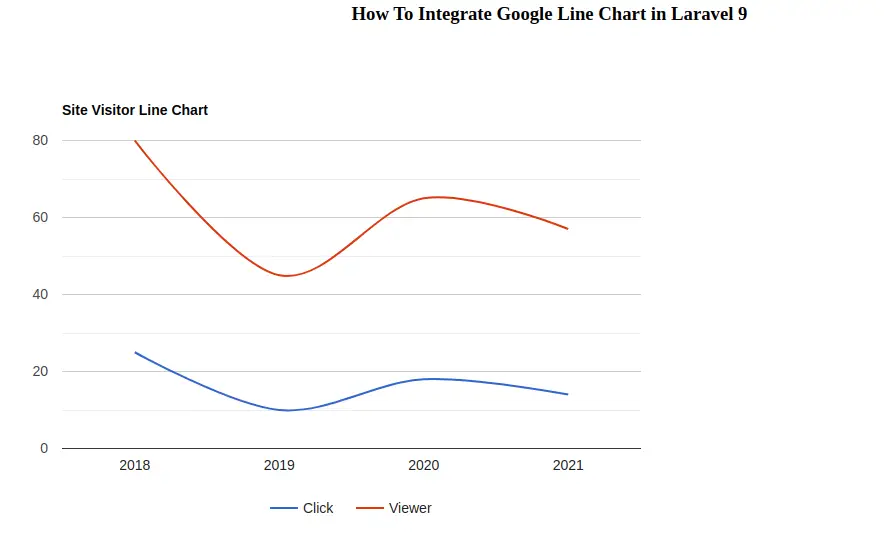
We hope this article helped you to learn about Google Line Chart Integration in Laravel 9 Tutorial in a very detailed way.
If you liked this article, then please subscribe to our YouTube Channel for PHP & it’s framework, WordPress, Node Js video tutorials. You can also find us on Twitter and Facebook.
Read more