
Dynamic pie charts are an excellent way to visualise data in online applications. They depict data composition and distribution in a straightforward and succinct manner. The combination of Laravel, a sophisticated PHP framework, and JavaScript tools such as Highcharts makes it simple to construct dynamic pie charts.
We will walk you through the process of constructing a dynamic pie chart in Laravel 10, allowing you to show and update data in an interactive and visually pleasing manner.
Throughout this article, we will look at how to build up a Laravel project, integrate Highcharts, and create dynamic pie charts that can fetch and display data in real-time.
Read More: How To Use Laravel 10 to Create a Dynamic Bar Chart
Let’s get started.
Laravel Installation
Open terminal and run this command to create a laravel project.
composer create-project laravel/laravel myblogIt will create a project folder with name myblog inside your local system.
To start the development server of laravel –
php artisan serveURL: http://127.0.0.1:8000
Assuming laravel already installed inside your system.
Create Database & Connect
To create a database, either we can create via Manual tool of PhpMyadmin or by means of a mysql command.
CREATE DATABASE laravel_app;
To connect database with application, Open .env file from application root. Search for DB_ and update your details.
DB_CONNECTION=mysql
DB_HOST=127.0.0.1
DB_PORT=3306
DB_DATABASE=laravel_app
DB_USERNAME=root
DB_PASSWORD=root
Setup Model & Migration
Open project terminal and run this command,
php artisan make:model BrowserStat -mIt will create two files –
- Model – BrowserStat.php inside /app/Models folder
- Migration file – xxx_create_browser_stats_table.php inside /database/migrations folder.
Open migration file and write this complete code into it.
<?php

use Illuminate\Database\Migrations\Migration;
use Illuminate\Database\Schema\Blueprint;
use Illuminate\Support\Facades\Schema;

return new class extends Migration
{
    /**
     * Run the migrations.
     *
     * @return void
     */
    public function up(): void
    {
        Schema::create('browser_stats', function (Blueprint $table) {
            $table->id();
            $table->string("name", 30);
            $table->float("total_usage");
        });
    }

    /**
     * Reverse the migrations.
     *
     * @return void
     */
    public function down(): void
    {
        Schema::dropIfExists('browser_stats');
    }
};
Read More: How To Create Laravel 10 CRUD Application with Bootstrap
Open model file BrowserStat.php and write this complete code into it,
<?php

namespace App\Models;

use Illuminate\Database\Eloquent\Factories\HasFactory;
use Illuminate\Database\Eloquent\Model;

class BrowserStat extends Model
{
    use HasFactory;

    public $timestamps = false;
}
Run Migration
Back to terminal and run this command.
php artisan migrateIt will create browser_stats table inside database.
Next,
Create Laravel Data Seeder
Create a seeder file to seed some dummy data for table.
Run this command to terminal –
$ php artisan make:seeder BrowserStatSeederIt will create a file BrowserStatSeeder.php inside /database/seeders folder.
Open file and write this complete code into it,
<?php
namespace Database\Seeders;
use Illuminate\Database\Console\Seeds\WithoutModelEvents;
use Illuminate\Database\Seeder;
use App\Models\BrowserStat;
class BrowserStatSeeder extends Seeder
{
/**
* Run the database seeds.
*
* @return void
*/
public function run(): void
{
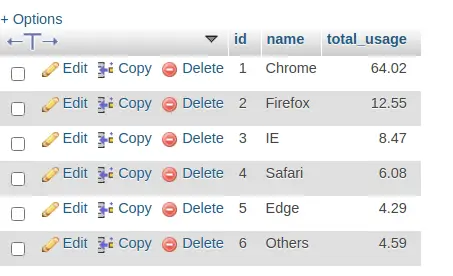
$data = [
array(
"name" => "Chrome",
"total_usage" => 64.02
),
array(
"name" => "Firefox",
"total_usage" => 12.55
),
array(
"name" => "IE",
"total_usage" => 8.47
),
array(
"name" => "Safari",
"total_usage" => 6.08
),
array(
"name" => "Edge",
"total_usage" => 4.29
),
array(
"name" => "Others",
"total_usage" => 4.59
)
];
BrowserStat::insert($data);
}
}
Run Seeder File
Run this command to terminal.
php artisan db:seed --class=BrowserStatSeederIt will create test data into database table.
Create Data Controller
Next, we need to create a controller class,
php artisan make:controller BrowserControllerIt will create a file BrowserController.php inside /app/Http/Controllers folder.
Read More: How To Use DomPDF To Generate PDFs in Laravel 10
Open file and write this complete code into it.
<?php

namespace App\Http\Controllers;

use Illuminate\Http\Request;
use App\Models\BrowserStat;
use Illuminate\View\View;

class BrowserController extends Controller
{
    public function index(): View
    {
        $browsers = BrowserStat::all();

        $dataPoints = [];

        foreach ($browsers as $browser) {

            $dataPoints[] = [
                "name" => $browser['name'],
                "y" => floatval($browser['total_usage'])
            ];
        }

        return view("pie-chart", [
            "data" => json_encode($dataPoints)
        ]);
    }
}
Create Blade Template File
Go to /resources/views folder and create a file with name pie-chart.blade.php
Open file and write this complete code into it.
<!DOCTYPE html>
<html lang="en">

<head>
    <title>Creating a Dynamic Pie Chart with Highcharts in Laravel 10 - ONLINE WEB TUTOR</title>
    <meta charset="utf-8">
    <meta name="viewport" content="width=device-width, initial-scale=1">
    <link rel="stylesheet" href="https://maxcdn.bootstrapcdn.com/bootstrap/3.4.1/css/bootstrap.min.css">
    <script src="https://ajax.googleapis.com/ajax/libs/jquery/3.5.1/jquery.min.js"></script>
    <script src="https://maxcdn.bootstrapcdn.com/bootstrap/3.4.1/js/bootstrap.min.js"></script>
</head>

<body>

    <div class="container">
        <h3 style="text-align: center;">Creating a Dynamic Pie Chart with Highcharts in Laravel 10 - ONLINE WEB TUTOR</h3>
        <div class="panel panel-primary">
            <div class="panel-heading">Creating a Dynamic Pie Chart with Highcharts in Laravel 10 - ONLINE WEB TUTOR</div>
            <div class="panel-body">
                <div id="pie-chart"></div>
            </div>
        </div>
    </div>

    <script src="https://code.highcharts.com/highcharts.js"></script>
    <script src="https://code.highcharts.com/modules/exporting.js"></script>
    <script src="https://code.highcharts.com/modules/export-data.js"></script>
    <script src="https://code.highcharts.com/modules/accessibility.js"></script>
    <script>
        $(function() {
            Highcharts.chart('pie-chart', {
                chart: {
                    plotBackgroundColor: null,
                    plotBorderWidth: null,
                    plotShadow: false,
                    type: 'pie'
                },
                title: {
                    text: 'Browser Usage World wide'
                },
                tooltip: {
                    pointFormat: '{series.name}: <b>{point.percentage:.1f}%</b>'
                },
                accessibility: {
                    point: {
                        valueSuffix: '%'
                    }
                },
                plotOptions: {
                    pie: {
                        allowPointSelect: true,
                        cursor: 'pointer',
                        dataLabels: {
                            enabled: true,
                            format: '<b>{point.name}</b>: {point.percentage:.1f} %'
                        }
                    }
                },
                series: [{
                    name: 'Browsers',
                    colorByPoint: true,
                    data: <?= $data ?>
                }]
            });
        });
    </script>
</body>

</html>
Add Route
Open web.php file from /routes folder. Add this route into it.
//...

use App\Http\Controllers\BrowserController;

//...

Route::get('browser-usage', [BrowserController::class, 'index']);

//...
Application Testing
Run this command into project terminal to start development server,
php artisan serveURL: http://127.0.0.1:8000/browser-usage
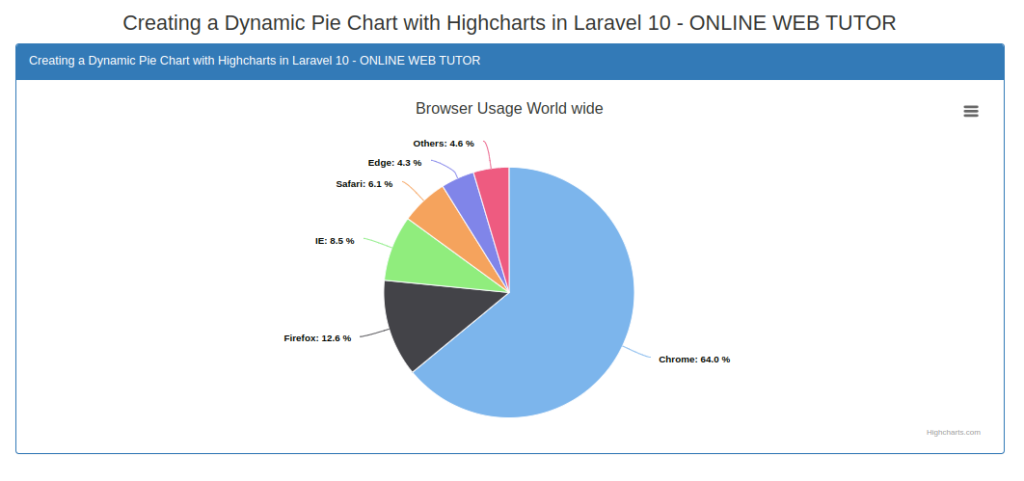
Once we open this URL, Pie Chart will be generated using Highchart plugin.
Output
That’s it.
We hope this article helped you to learn about Laravel 10 Create a Dynamic Pie Chart with Highcharts Tutorial in a very detailed way.
If you liked this article, then please subscribe to our YouTube Channel for PHP & it’s framework, WordPress, Node Js video tutorials. You can also find us on Twitter and Facebook.
Read more